Everyone in Matchforce has access to Reports & Dashboards, which means you have the flexibility to utilize these tools to manage day-to-day processes as well as analyze data.
As you begin working with Reports & Dashboards, here are a few helpful hints.
-
Skip Ahead
- Salesforce Resources
- Dashboards Overview
- Program Dashboards Descriptions
- Reports Overview
- National and Local Reports
- Moving Forward with Data
- Finding & Utilizing Data
- Report Type Suggestions
Salesforce Resources
Salesforce has multiple resources to help you better understand how to utilize Reports & Dashboards.
Below are a few links that may be helpful as you get started:
Reports & Dashboards Trailhead
You may find as you examine reports connected to dashboards that you want to add and edit report fields. At the same time, many agencies will create brand new reports with corresponding dashboards knowing that Matchforce creates a great deal of flexibility within reporting.
When opening reports, it may not always be clear how data is filtered. Examine the filters that have been placed on the reports to better understand what type of data is populated within the report you’re viewing.
When saving reports and dashboards, always save to a folder that you have created and not to the broader folder in Matchforce, so that only your agency sees your list of reports and dashboards.
Dashboards Overview
Things to Know About Dashboards
All Matchforce users have access to dashboards and the accompanying reports.
Every dashboard is created from data in an existing report. The dashboard component is simply a visual representation of a specific report data point. By clicking on![]() at the bottom of each component, you will be directed to the report.
at the bottom of each component, you will be directed to the report.
You may create your own dashboards and save them to agency folders for internal agency use.
When dashboards are opened, data may need to be refreshed. At the top of each dashboard, you’ll see the last time the data was refreshed. The more columns and data points exist in the report the dashboard is connected to, the longer the refresh period will be. Keep this in mind as you create your own dashboards.
Clicking ![]() will open the dashboard to a larger view and will allow you to scroll through all components on the dashboard.
will open the dashboard to a larger view and will allow you to scroll through all components on the dashboard.
Clicking ![]() allows you to download the image for your own use.
allows you to download the image for your own use.
Clicking ![]() allows you to post the visual component in chatter.
allows you to post the visual component in chatter.
Accessing the Basic BBBSA Dashboards
To better understand what is captured within these components: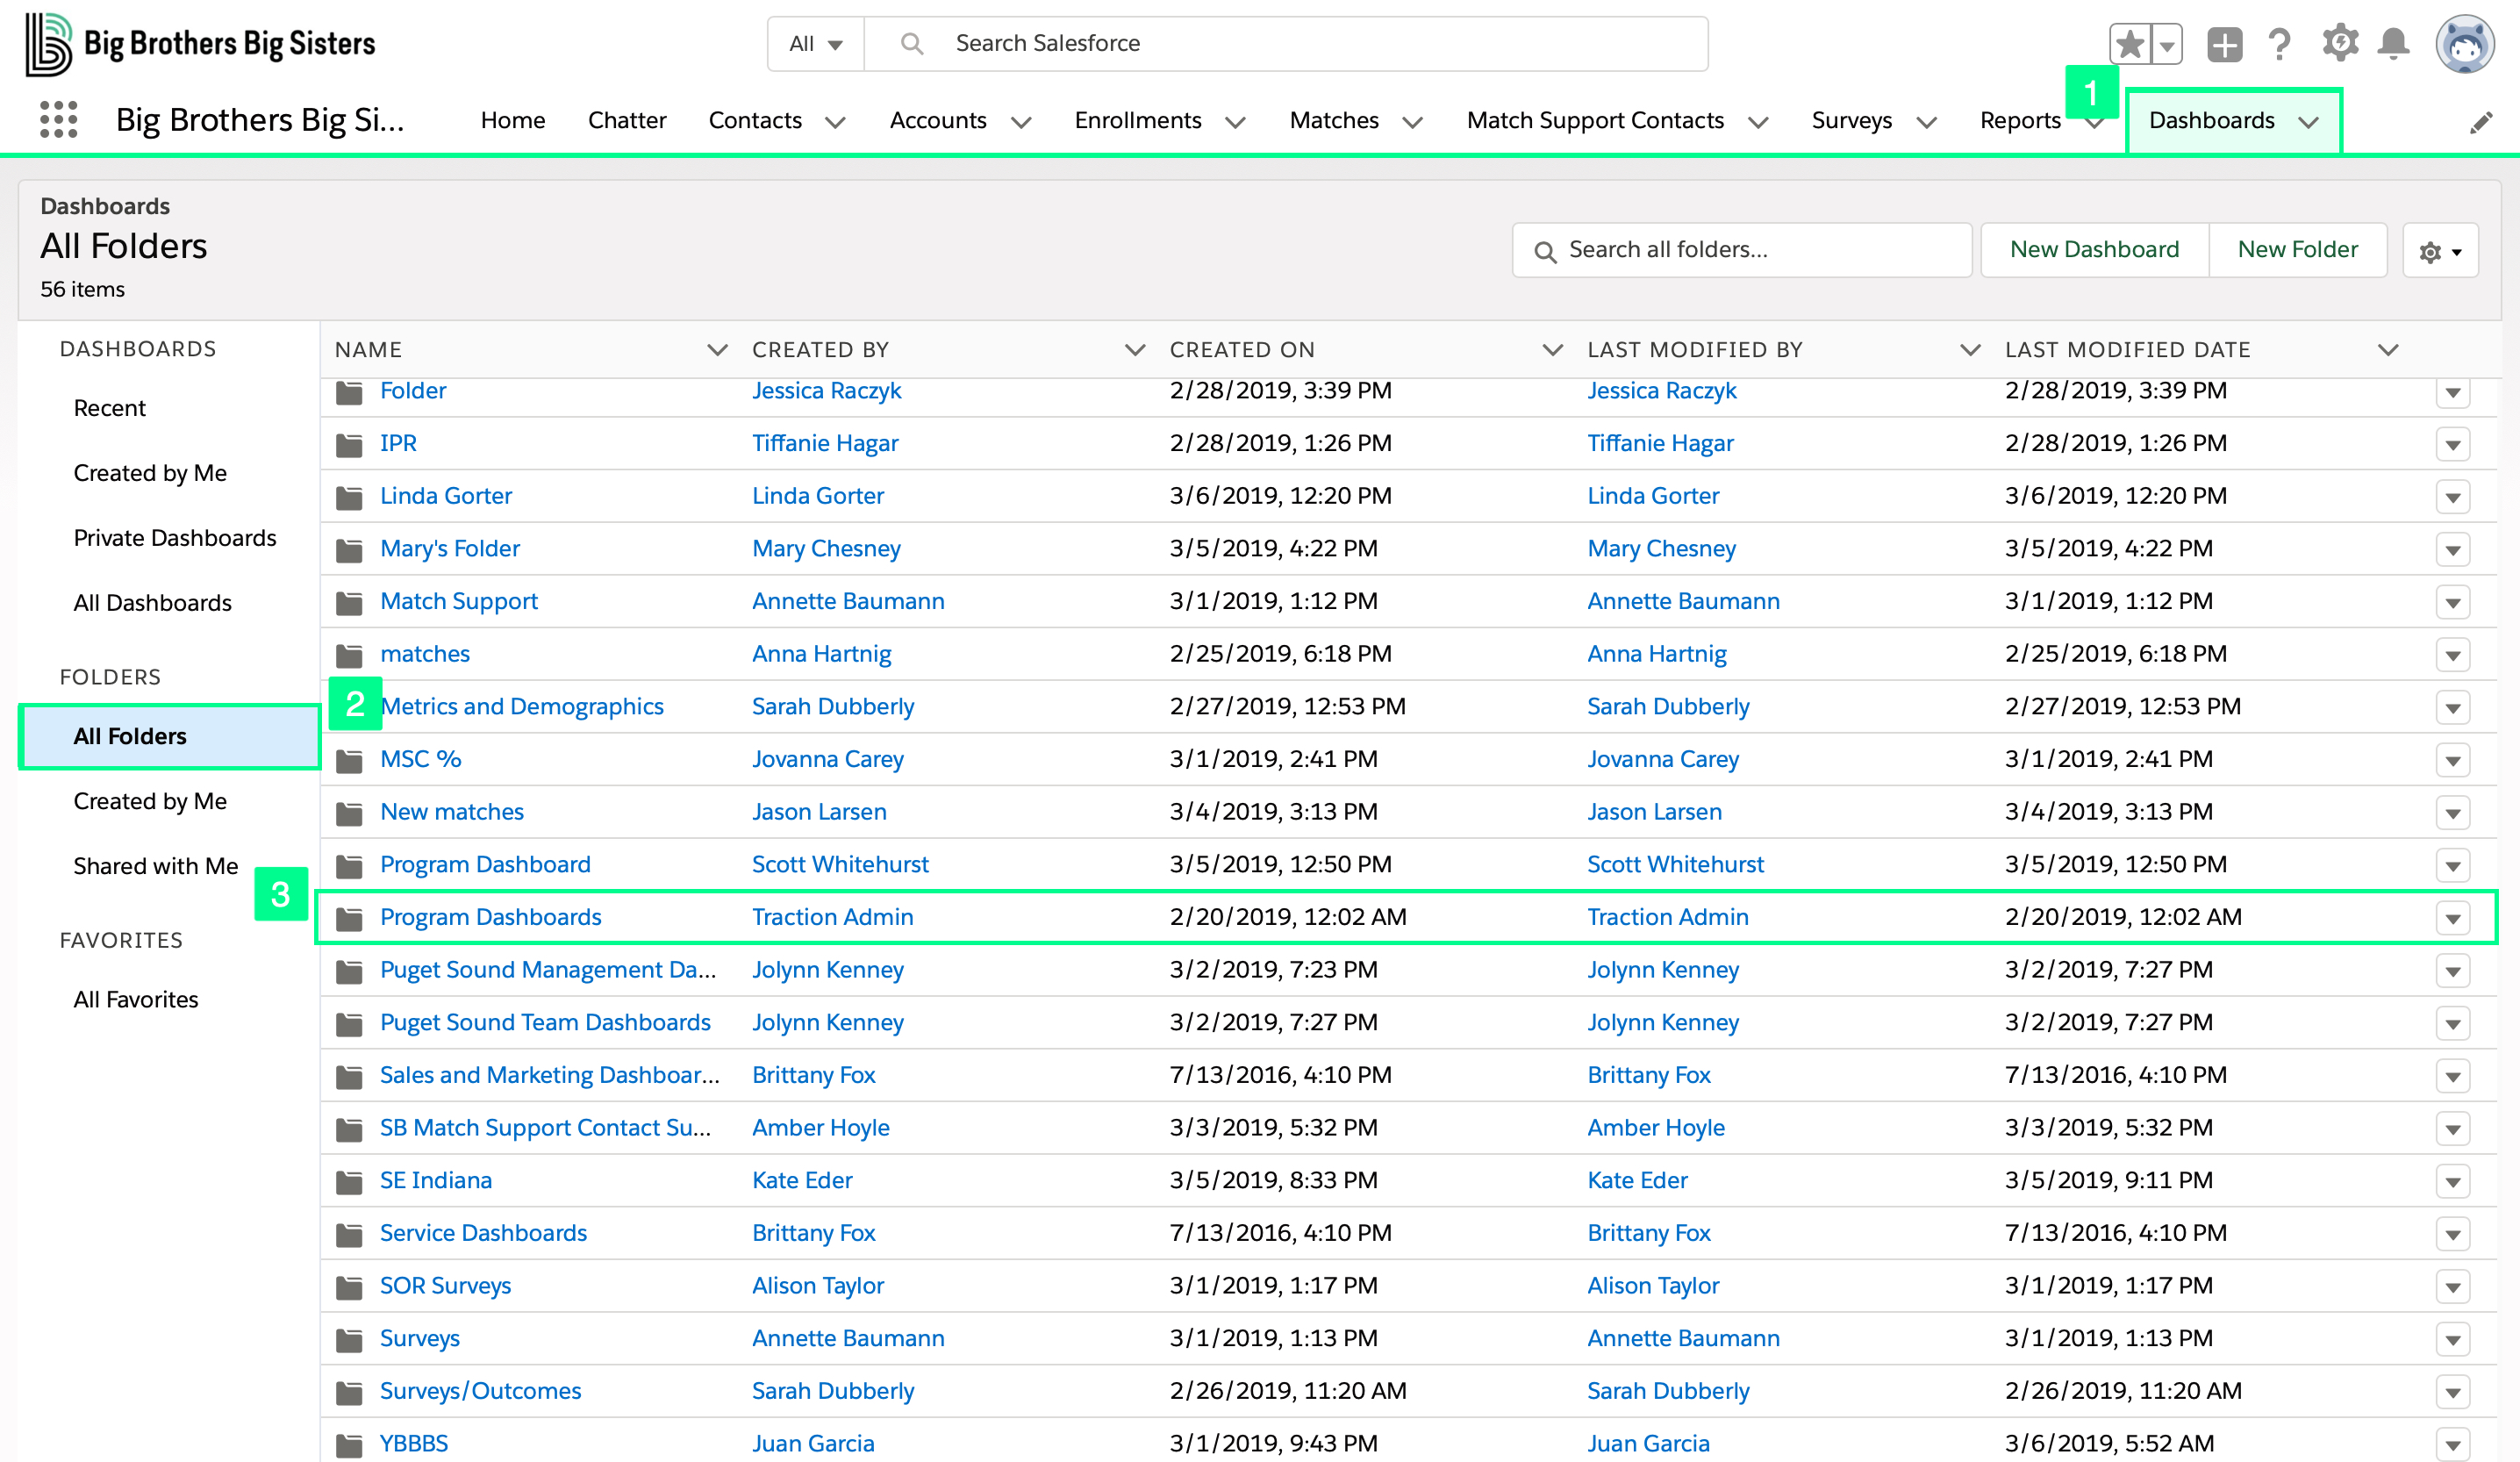
- Navigate to the Dashboards tab.
- On the left-hand side of the page, click all folders.
- Click on the Program Dashboards folder. (The list below contains each current BBBSA created dashboard – “Created by” for these dashboards equals ‘Traction Admin.’)
- Open each dashboard and review what’s contained within it.
- Next, open the corresponding report to see more detailed data the dashboard is pulled from.
Program Dashboard Descriptions
Activity Management Dashboard
This dashboard allows you to see specific productivity data tied to record types across the system as well as activities in general. This dashboard’s components are as follows:
- Activities Completed This Month by User
- Contact History Report Last 30 Days
- Enrollment Activity Report Last 30 Days
- Match History Report Last 30 Days
Contact Demographics Dashboard
Specific demographic data for all contact types is displayed within this dashboard. Filters are available by Contact Record Type and Enrollment Stage. This dashboard’s components are as follows:
- Gender
- Zip Code
- Race
- Nationality
- Sexual Orientation
- Household Income
- Subsidized Lunch
- Household Members
Data Quality | Enrollments
Data Quality Dashboards are provided to allow you to track specific data points that may not be required fields in the system but are critical data points. The expectation is that these components reflect a 0 value, which indicates the fields were not saved as blank or empty across records. Records in the Ready for Review and RTBM Stage are examined. Note that this dashboard may be filtered by Stage as well as Enrollment Record Type. Components are listed below.
- References ‘Completed by’ Blank
- Prior BBBS Involvement Blank
- Assessment ‘Completed by’ Blank
- Interviewer Blank
- Driver’s License Blank
- Employer Blank
- Sexual Orientation Blank
- Relationship Status Blank
- Email Blank
- Address Blank
- Graduation Year Blank
- Mobile Phone Blank
- Gender Blank
- SSN Blank
Data Quality | Matches
Data Quality Dashboards are provided to allow you to track specific data points that may not be required fields in the system but are critical data points. The expectation is that these components reflect a 0 value, which indicates the fields were not saved as blank or empty across records. Records in Active matches are examined. Note that this dashboard may be filtered by Stage as well as Enrollment Record Type. Components are listed below.
- Employer / School Blank
- Sexual Orientation Blank
- Relationship Status Blank
- Mailing Address Blank
- Email Address Blank
- Mobile Number Blank
- Race / Ethnicity Blank
- Graduation Year Blank
- Gender Blank
- SSN Blank
- Scheduled MSCs for Closed Matches
- Birthdate Blank
Enrollment Management Dashboard
This dashboard contains specific data points that staff may utilize to monitor and review enrollment processes. The dashboard may be filtered by Contact Record Type as well as Gender. Individual components are listed below.
- Enrollments by Stage
- Enrollments by Owner
- RTBM by Program Name
- Littles RTBM
- New Matches YTD
- Average Days Waiting to be Matched
- YTD
- New Contacts YTD
- Orientations Completed YTD
- Assessments Completed YTD
- Ready to be Matched YTD
- Pre-Match Training Complete YTD
Match Management Dashboard
This dashboard contains specific data points that staff may utilize to monitor and review match processes. Individual components are listed below.
- Matches Open Jan 1
- New Matches YTD
- Pending Closure Matches
- Children Served YTD
- Matches Overdue for Match Support
- Not Approved Matched YTD
- Active Matches by MSS
- Active Matches by Program
- Active Matches by Status
Match Closure Management Dashboard
This dashboard contains specific data points that staff may utilize to monitor and review match closure data. Filters for Program Type and Little Gender are available. Individual components are listed below.
- Closed Matches YTD
- Closed Matches by Month AML YTD
- Closed Matches YTD by Site
- Closed Matches by MSS YTD
- Child Safety Closures YTD
- Closure Meeting YTD
- Littles Re-Engaged YTD
- Bigs Re-Engaged YTD
- Closed Matches YTD by Status
- Closed Matches YTD By Big Age
- Closed Matches YTD by Reason
- Closed Matches YTD by Program Type
Match Support Dashboard
This dashboard contains specific data points that staff may utilize to monitor and review match support processes. Individual components are listed below.
- Completed MSCs – On-Time Rate YTD
- Matches Overdue for Match Support
- Completed MSCs by Contact Method
- Matches Overdue for Match Support (# of contacts)
- Number of Overdue MSC Dates
- Completed MSCs – On-Time Rate YTD by MSS
- Matches Overdue for Match Support by MSS
- % of Matches Overdue for Support
- Scheduled Late MSCs by Owner
- Average Meetups by Duration
- Average Time Spent together by Duration
- Completed MSCs – Rate by Duration
National | Average Match Length Management
Average Match Length (AML) Metrics across the Network are displayed in the components; however, when view reports is selected, your agency data is displayed. To create an agency-specific dashboard with this data, click save as and save the dashboard to a folder connected to your agency. Individual components listed below.
- SB AML YTD
- SBF AML YTD
- CB AML YTD
- SB+ AML YTD
- SB Open AML
- SBF Open AML
- CB Open AML
- SB+ Open AML
- Matches Closed this Month by Duration
- Matches Closed YTD by Duration
National | Enrollment Satisfaction Survey – Bigs and Guardians
Each question in the Enrollment Satisfaction Survey (ESS) data from across the network is displayed here with gauges indicating average responses; however, when view reports is selected, your agency data is displayed. To create an agency-specific dashboard with this data, click Save As and save the dashboard to a folder connected to your agency.
National | Match Satisfaction Surveys – Bigs & Guardians
Each question in the Enrollment Satisfaction Survey (ESS) data from across the network is displayed here with gauges indicating average responses; however, when view reports is selected, your agency data is displayed. To create an agency-specific dashboard with this data, click Save As and save the dashboard to a folder connected to your agency.
National | Strength of Relationship | Bigs
Each question in the Strength of Relationship (SoR) data for Bigs across the network is displayed here with gauges indicating average responses; however, when view reports is selected, your agency data is displayed. You may filter this report by SoR type as well as program type. To create an agency-specific dashboard with this data, click Save As and save the dashboard to a folder connected to your agency.
National | Strength of Relationship | Littles
Each question in the Strength of Relationship (SoR) data for Littles across the network is displayed here with gauges indicating average responses; however, when view reports is selected, your agency data is displayed. You may filter this report by SoR type as well as program type. To create an agency-specific dashboard with this data, click Save As and save the dashboard to a folder connected to your agency.
National | Survey Completion Dashboard
Survey Completion data is tracked within this dashboard. To create an agency-specific dashboard with this data, click save as and save the dashboard to a folder connected to your agency. The following components make up this dashboard:
- Expiring Match Surveys in Next Week
- % Surveys Completed YTD
- Surveys Not Completed by Reason
- YOS Completion Rate YTD
- RPI Completion Rate YTD
QA Management Dashboard
This dashboard provides agencies with data related to Quality Assurance (QA) reviews (spot-check or scored) that have been completed over the course of the year.
- Scored Enrollment QA Records YTD
- Scored Match QA Records YTD
- Enrollment QA Score Month by Month YTD
- Match QA Score Month by Month YTD
- E – QA Average Score
- M – QA Average Score
- Enrollment QA Complete YTD
- Match QA Complete YTD
- QA By Reviewer and Type YTD
- QA By Type YTD
In addition to average scores for Enrollment and Match element, components are available that reveal whether specific elements are scored as having been addressed during QA reviews.
Reports Overview
Things to Know About Reports
You have been provided with basic reports to help you access the basic data that your agency utilizes. However, the expectation is that all agencies will edit these reports to meet their own needs as well as create brand new reports to pull more specific types of data.
Accessing the Basic BBBSA Reports – to better understand what is captured within the basic reports, navigate to the reports tab – and click all folders on the left-hand side of the page. Next, click on the National & Local Data folder. Six folders are contained within it and contain different types of data that complements the dashboard data listed above.
When saving reports, always save your edited or created reports to a folder that you have created and not the National & Local Data folders in Matchforce so that only your agency sees your list of reports and dashboards.
National and Local Reports Description
Contacts & Demographics Folder
Child Safety Concern – Contact records flagged as child safety are contained within this report. Note this is filtered by my contacts.
Data – All Bigs & Littles currently Active (Enrollment Stage = Open, Ready to be Matched, Matched) are included within this report. Detailed demographic data is included within this report.
Details with Enrollment Stage – All Bigs and Littles currently Active (Enrollment Stage = Ready to be Matched, Pending Match, Matched) with mailing addresses are included in this report.
MSC Reports Folder
Owner with Completion Status – Detailed content related to MSCs completed – grouped by match owner – is available within this report. This will likely be utilized to complement the Match and Match Support Dashboards.
Parent Match Support Contact – All Site-Based parent contacts are tracked within this report in order to populate the SB parent MSC tracking.
National Enrollment Reports
The two reports listed below contain data tied to all RTBM participants in your agency at the current time. Each report is connected directly to the matching symbol ![]() under Littles Ready to Be Matched or Bigs Ready to Be Matched on applications. You may access these reports through that link or directly from this folder.
under Littles Ready to Be Matched or Bigs Ready to Be Matched on applications. You may access these reports through that link or directly from this folder.
- Matching – Littles RTBM
- Matching – Bigs RTBM
National Match Reports
The four reports below will serve as a complement to several dashboards listed above. Each report provides a more detailed look into matches and information related to those matches.
- Matches – Surveys Due
- Matches – Active by Program Name
- Matches – Served Current Year
- Match History Detail
National Grant Reports
The four reports below provide agencies with data connected to affiliate grants. Each report will likely need to be modified to meet the specific needs of each agency.
- Grants with Matches Report
- Last Month TCS – JJ8
- Last month – All Matches
- Last Month – MYIO
Program Reports
Non 1:1 Program Participation – This report provides summary level information about non-1:1 mentoring programs.
QA Reports
Enrollment Completion – Enrollments with completed QA reviews from the current quarter are listed within this report.
Enrollments Made RTBM – Any enrollment made RTBM within the last 30 days is included here and reveals whether or not a QA review was completed on that enrollment. Agencies will likely use this report to help determine which enrollments to review.
Match Reviews – Any currently active match is included within this report. Data reveals whether or not a QA review was completed on that match. Agencies will likely use this report to help determine which matches to review.
Moving Forward with Data
As you start moving forward and consider data you may want to review regularly, here are a couple of quick ideas.
Want to understand how your staff is doing with Match Support? Look at your Match Support Dashboards.
For overall numbers, examine these two dashboards combined. One tells you how the team did on their completed MSCs and the other tells you how many matches still have overdue contacts within them.
- Completed MSCs – On-Time Rate YTD (On-Time % should be high)
- Matches Overdue for Match Support (This number should be low)
Remember: These numbers are consistently changing and are able to be reviewed on a moment-by-moment basis.
Want to know your children served for 2019 or how many matches you’ve made? Take a look at your Match Management Dashboard. You’ll find active match numbers here broken down in several categories.
Want to get a quick snapshot of your early closures? Open the National-Average Match Length dashboard and look at closures by duration.
Need to know more? Open the report connected to the component to see why those matches closed early.
Prepping for QA Reviews? Open your QA Reports folder to see the enrollments and matches that you’ve already QA’ed to help you get a sense of where you need to start.
Need to see your demographic data about Bigs and Littles or a report that tells you about the matches you’ve served this year? Navigate to your Contacts & Demographics Report Folder to see Contact data or to the National Match Reports folder to see Matches – Served Current Year.
Remember: You can add, remove, or rearrange columns in any report based on what you need.
Finding & Utilizing Data
Key Points For Consideration
Reports will not look or act exactly like AIM reports. Within Matchforce, you’ll find that multiple report types and dashboards will often provide data that’s tied to similar data points allowing you to determine which reports are most helpful to you.
BBBSA and the Network will continue to have conversations about what metrics are most significant to track within Matchforce.
If you haven’t already done so, review the resources listed above and in the WalkMe app related to Reports & Dashboards.
ALWAYS SAVE YOUR REPORTS AND DASHBOARDS IN YOUR AGENCY’S PRIVATE FOLDERS.
Before beginning to pull and save reports or dashboards, be sure your Agency Administrator has shared agency-specific folders with you so that you are able to save your Reports & Dashboards to those specific folders and not public folders. (See the WalkMe menu for a walkthrough displaying how to create those folders.)
Remember, BBBSA has provided a sample of reports in the National & Local Data and Program Dashboards folders. However, by clicking ![]() you have the freedom to create other reports you may need.
you have the freedom to create other reports you may need.
Every report you pull may be edited and saved to meet your specific needs. You are not limited to the content you see in the basic report template. Add columns. Add filters. Group data in a way that is most helpful to you. Do what works best for you. You’re not limited!
Whether you open a dashboard component and click on ![]() under the data, or you utilize a report in the National & Local Data folder, every report is created from a report type existing when you click
under the data, or you utilize a report in the National & Local Data folder, every report is created from a report type existing when you click ![]() .
.
For example, the Enrollments with Stage dashboard component was created from the Contacts with Enrollments report type and named Open Enrollments by Stage in the reports folder.  As you get more comfortable with these data points, you’ll become more and more comfortable with these report types.
When you click on ![]() and select a report type, pay attention to the With and With or Without language. This significantly impacts what data will be pulled into the report. For example, if Matches with YODPs is selected – only matches that have YODP records attached will be pulled into the report. If Matches with or without YODPs is selected, all matches whether they do or don’t have YOPDs will be pulled into the report.
and select a report type, pay attention to the With and With or Without language. This significantly impacts what data will be pulled into the report. For example, if Matches with YODPs is selected – only matches that have YODP records attached will be pulled into the report. If Matches with or without YODPs is selected, all matches whether they do or don’t have YOPDs will be pulled into the report.
Report suggestions below will not reference the specific Reports & Dashboards already created by BBBSA / Traction and will only reference the specific report types in ![]() the area.
the area.
Always review Filters when opening reports and remove/modify any that aren’t helpful. Once the report is saved to your folder, your newly set filters will be solidified.
Report Type Suggestions
Please keep in mind that options listed below are a small sample of the reports that you have access to in Matchforce.
Participant (Big, Little, Parent/Guardian) Details
Scenario: Your agency wants to pull reports that give you specific demographic, enrollment, and contact information. You may want to use this data to:
- Identify the number of participants in stages
- Better understand the make-up of your volunteers and/or children
- See contact information for participants across all stages
- Parent/Guardian & Little Household Data
- Review time taken to complete process steps
Here are some report type options:
- Contacts with Enrollments – Big & Little contact data | Parent/Guardian contact data. No contacts without enrollments are included in this report.
- Contacts with Enrollments with Parent/Guardians – Bigs will not be included here since they don’t have a Parent/Guardian.
Match Details
Scenario: Your agency wants to see what data is tied to all active matches. You may want to use this data to:
- See active match numbers
- See matches divided by program
- See matches and sites associated with them
- See demographic data tied to all Bigs & Littles (email, address, age, gender, race/ethnicity, etc.)
- See matches match owner
Here are some report type options:
- Contacts with Enrollments with Matches – Each line will represent a different contact.
- Matches with Contacts with Programs – Each line represents one match. Contact record fields as well as program and match fields are available in this report.
- Contacts with Enrollments with Matches with Match Support Contacts – Field data from each record type is available within this report.
- Matches – Fields from Match records are available here.
- Contacts with YODP Goals and Match or Contacts with or without YODP Goals – Provides data connected directly to YODP content.
Match Support Contact Data
Scenario: Your agency wants to track match support contacts (MSCs) that have been completed and should be completed. You may want to use this data to:
- Identify how many MSCs have been completed late or on-time
- Matches that have overdue due dates
- Completion rate by staff
Here are some report type options:
- Matches with Match Support Contacts – Filters assume completion, but can be modified.
- Matches with Match Support Contacts and Contacts
- Activities with Match Support Contacts – Activities related to MSCs are pulled into this report.
Looking for a report similar to the Support Contact Summary reports from AIM? Review the Match Management Dashboards. Components and reports tied to on-time percentages as well as matches with overdue MSC due dates will help extract this data. The dashboard also contains components connected to Match Owner and reports may be edited to meet your specific needs.
Grant Reports
Scenario: Your agency wants to identify which individuals are currently tied to grants you are tracking or could potentially be added to grants. You may want to use this data to:
- Identify demographic information tied to contacts connected to your grants
- Track which matches are currently attached to different grants
- Assess whether you’re reaching goals connected to grants
Here are some report type options:
- Grants with or without Matches
- Contacts with or without Grants
- Contacts with Matches and Grants
Looking for a JJ report? Open the National Grant Reports folder to see several specific report types tied to BBBSA Grants.
Task & Activity
Scenario: Your agency wants to review specific activities and tasks that your staff has completed. Several reports with Activity data are provided within Matchforce allowing you to review process steps being completed.
Here are some report type options:
- Activities with Contacts and Referral Details
- Activities with Enrollments
- Activities with Background Checks
- Activities with Matches
- Activities with References
Quality Assurance
Scenario: Your agency wants to see content connected to Quality Assurance (QA) reviews. You may want to use this data to:
- Identify matches or enrollments that have been or need to be QA’ed (spot-check or scored)
- Review results of QA reviews and share feedback with staff
- Identify whether QA team members are completing QA reviews as expected
Here are some report type options:
- Matches with or without Scored QA Records
- Applications with or without QA Records
- Matches with or without QA Records
- Enrollments with QA or Matches with QA
Looking for more? Open the Quality Management Dashboard to see more data.